Overview
This page provides a walkthrough for new users who want to extract tables from PDFs. For more detailed reference material, see the Table Extraction - Reference page.
Example: Simple Table
In this example, we will extract a single table from an Amazon 8K filing. This table is simple, so extracting the data only takes a few steps.
Step 1: Enable the Appropriate Options
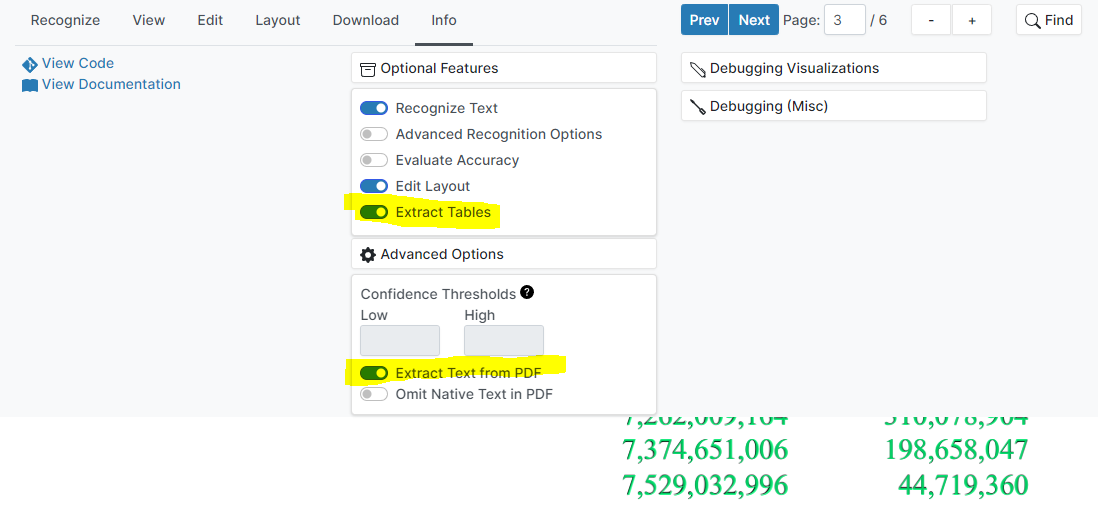
Table extraction is an experimental/optional feature, so needs to be enabled manually.
- Select
Info->Optional Features->Extract Tablesto enable table extraction. - If your document contains native text, select
Info->Advanced Options->Extract Text from PDFto use the text already in the PDF.- This option should only be enabled for native text documents–it should not be used for documents that contain an invisible OCR layer over images.
- This option must be set prior to uploading the document.
Step 2: Upload Document, Create Text Layer
Upload your document and use Scribe OCR as you would normally to create a high-quality text layer. This step is better documented on other pages, however the basics are listed below.
- Upload your document along with (optionally) external OCR data (Tesseract
.hocror Abbyy.xml). - If you are not relying on existing text in the document, or uploading your own OCR data, run text recognition to create an OCR text layer.
- Select
Recognize->Recognize Text
- Select
- If relying on OCR data–whether generated by Scribe OCR or uploaded–review the text layer and correct any errors.
- This step can be skipped when using the text layer from a text-native PDF.
- In all other cases, all OCR data is likely to contain a non-zero number of errors.
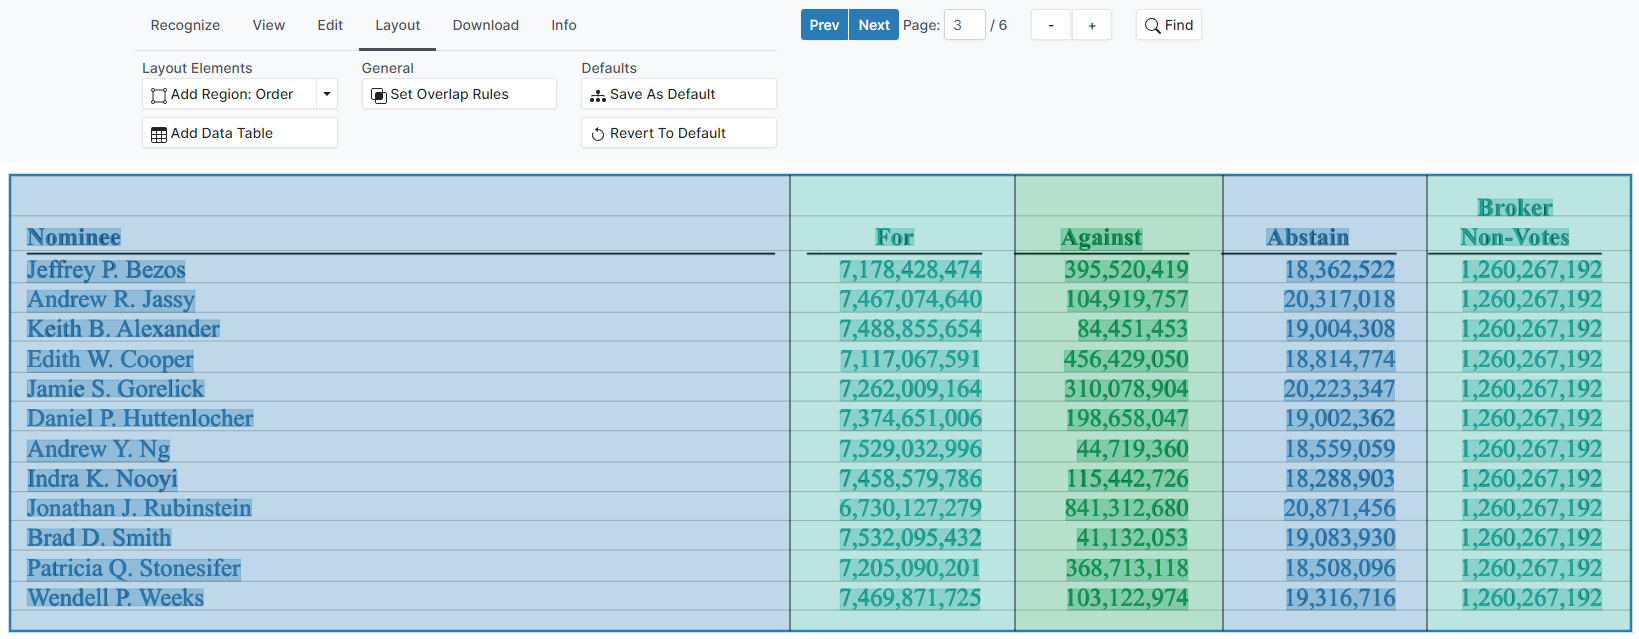
Step 3: Add Table Layout
Use the tools in the Layout tab to draw a table over the text layer. Start by selecting Layout -> Add Data Table and drawing a rectangle over the entire table. This produces a single-column table, which is represented by a colored rectangle.
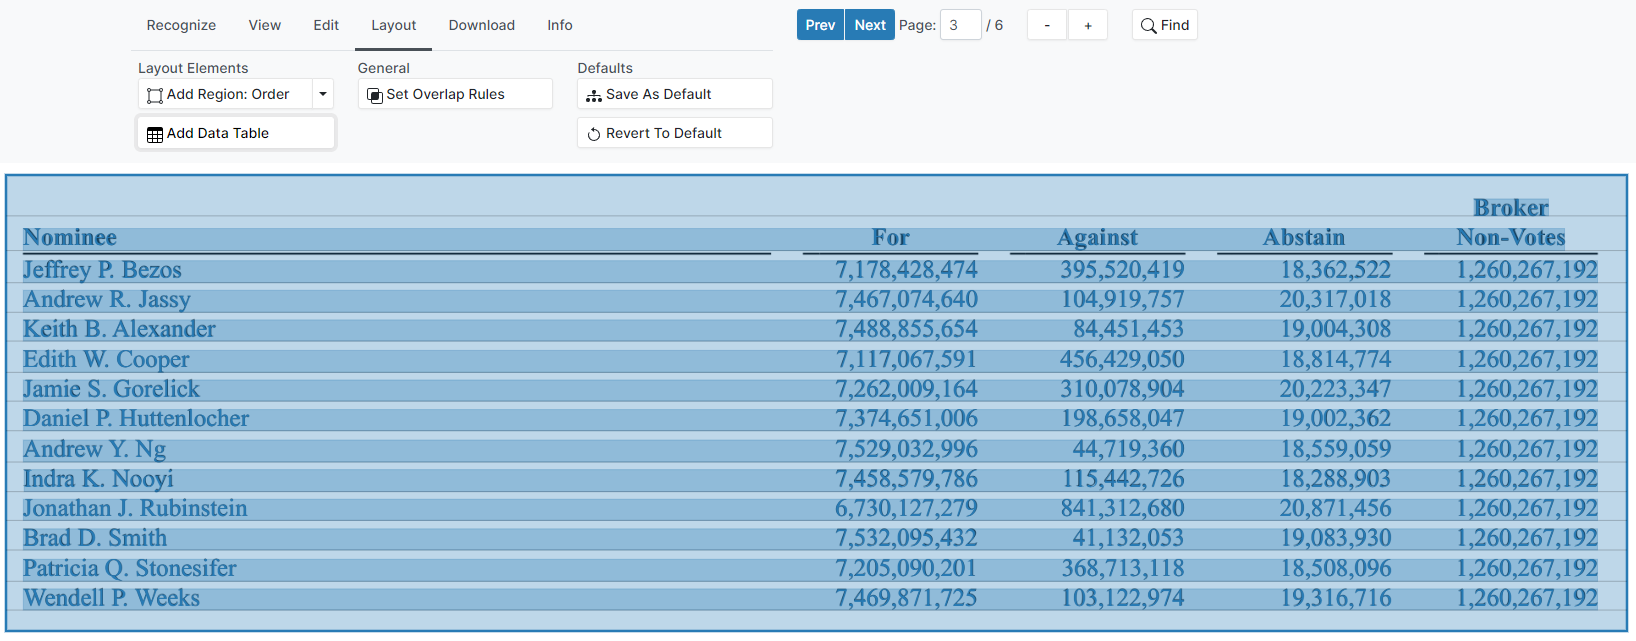
Next, add column separators to create a multi-column table. To split a column, right click the table where the column divider should be added, and select Split Column.
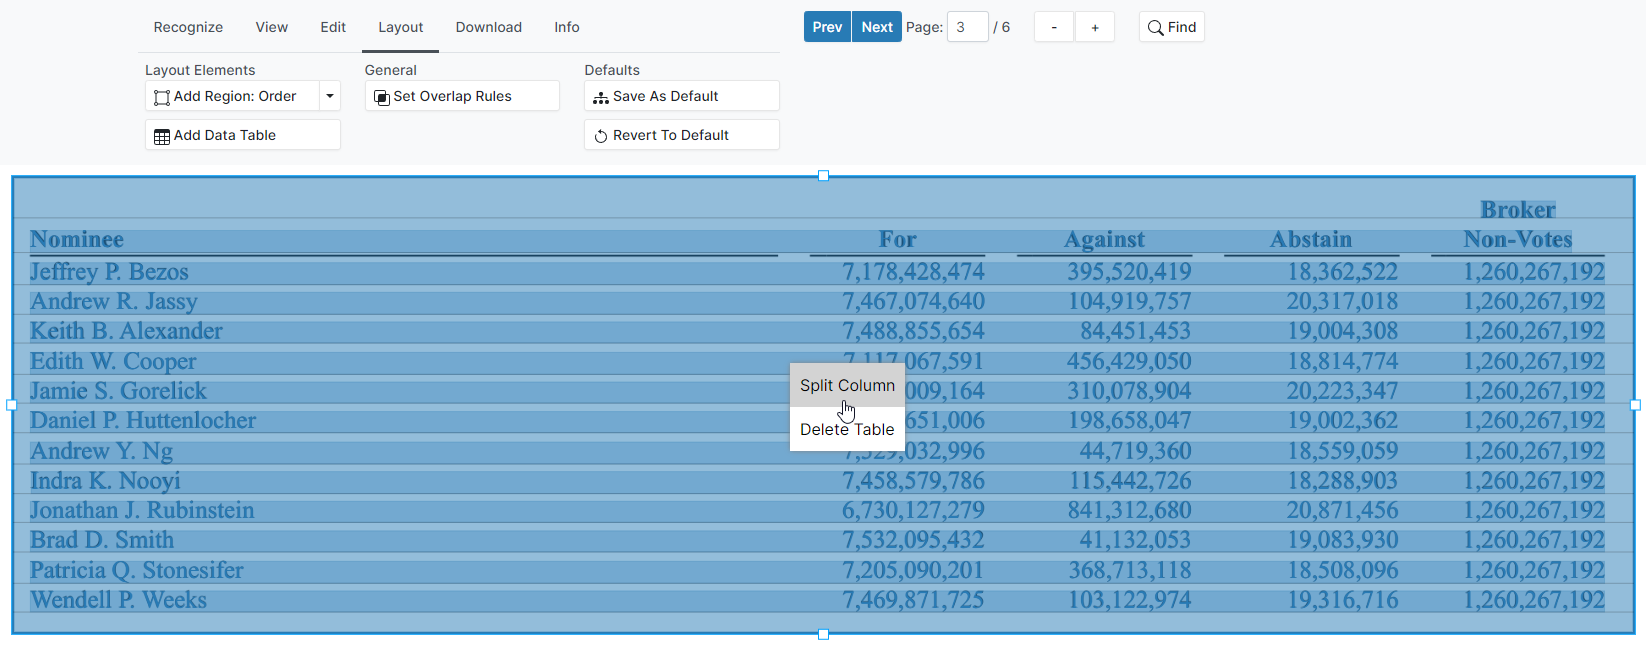
Proceed to add the remaining columns. The column bounds can be adjusted by dragging the column divider. The image below shows a table with 5 columns, with the dividers positioned appropriately.
Step 4: Export
Once the text layer and table layout are both accurate, it is time to export the data. To export the table in a tabular format, select Download -> Format -> Xlsx, and then click Download. A .xlsx file containing your table should download. 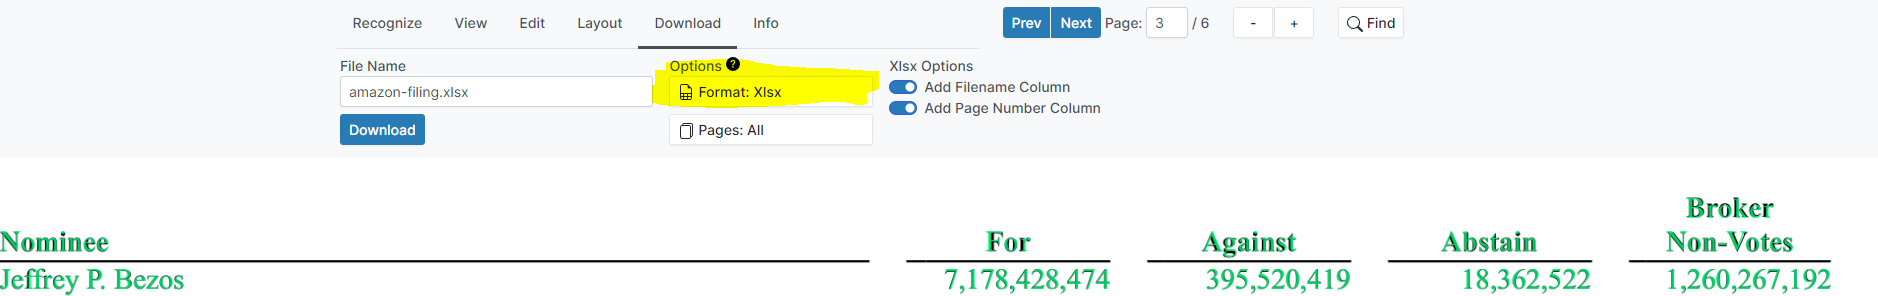
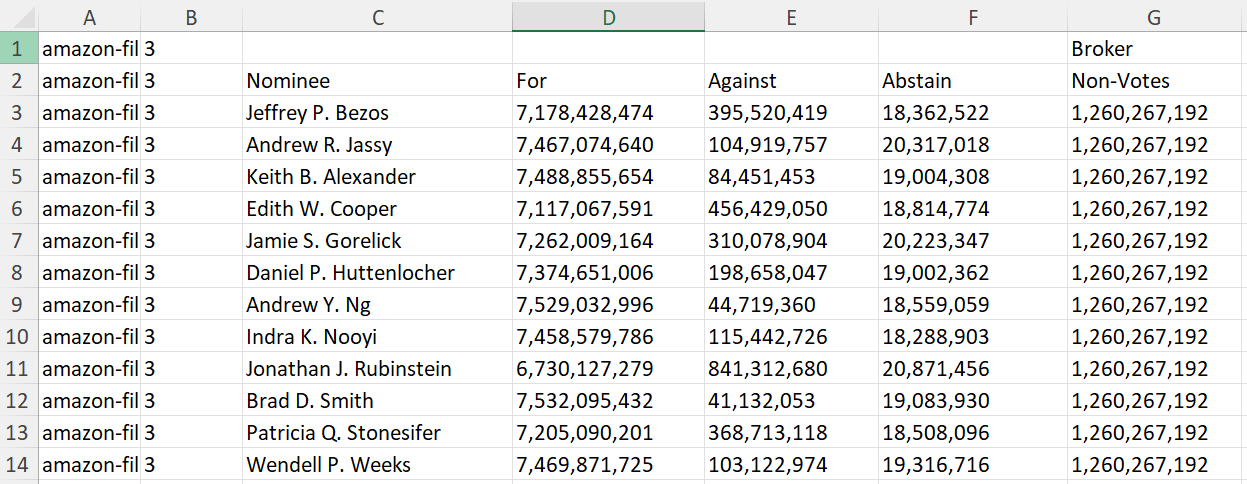
As a general practice, it is prudent to always download a .scribe file in addition to the file format you ultimately want. While several output formats can be re-imported, .scribe is the only format that allows for restoring an editing session later without losing any data, so allows for fixing any mistakes you may notice in the future. .scribe files only contain the text layer, so they must imported alongside the original image/PDF files to fully restore an editing session.
Common Special Cases
Values that Span Multiple Columns
Some tables include single entries that span the width of multiple columns. For example, below is part of a different table from the Amazon 8K filing showing shareholder votes by proposal. The description of each proposal spans the width of all columns.
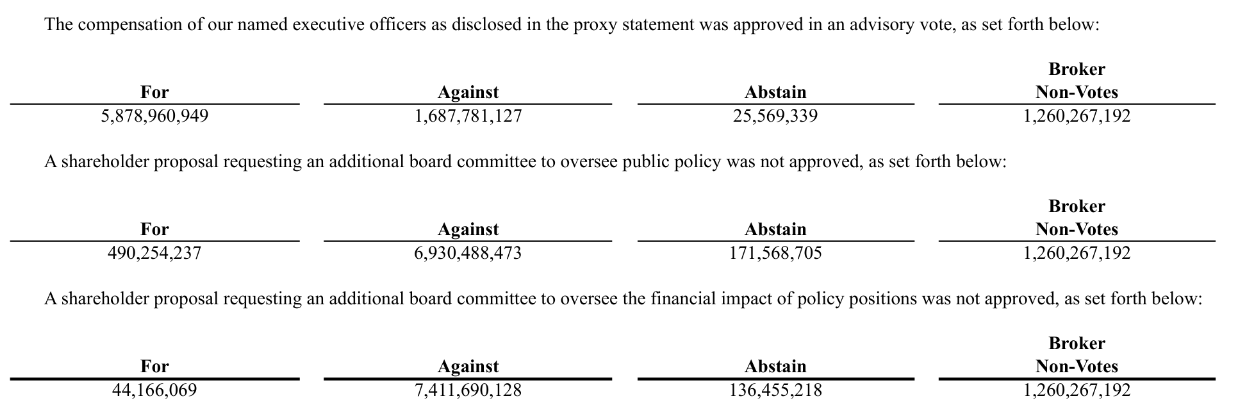
By default, individual words are assigned to the column they overlap the most with. However, this behavior is undesirable in this case, as it results in the proposal descriptions being split up and assigned to the same columns as the vote totals. 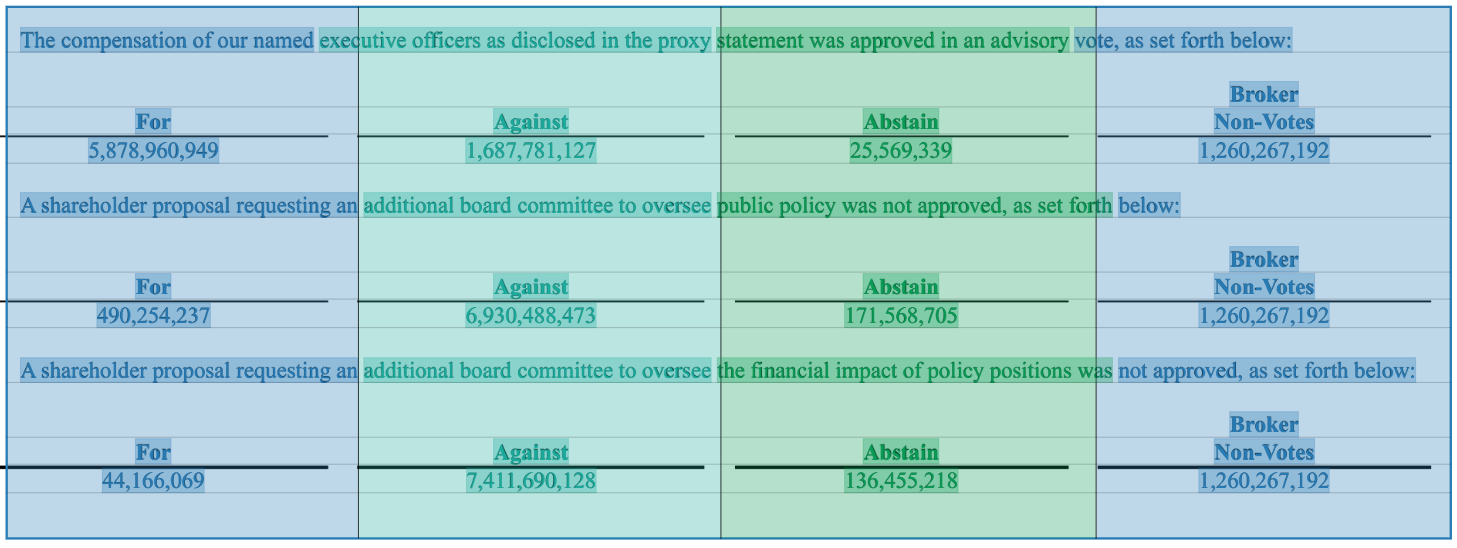
To handle this case, start by creating a new column that includes only the start of the proposal description. Next, select the new column, open the Set Overlap Rules drop-down menu, set the rules to Left and Line. This tells Scribe to include all lines where the left bound is inside the selected column. 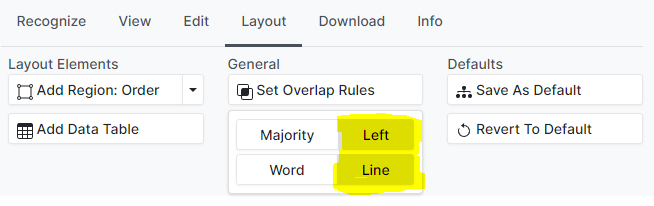
We can confirm this change worked as expected by checking the viewer. All proposal descriptions are now highlighted the same color as the first column, indicating they are all being assigned to the first column. 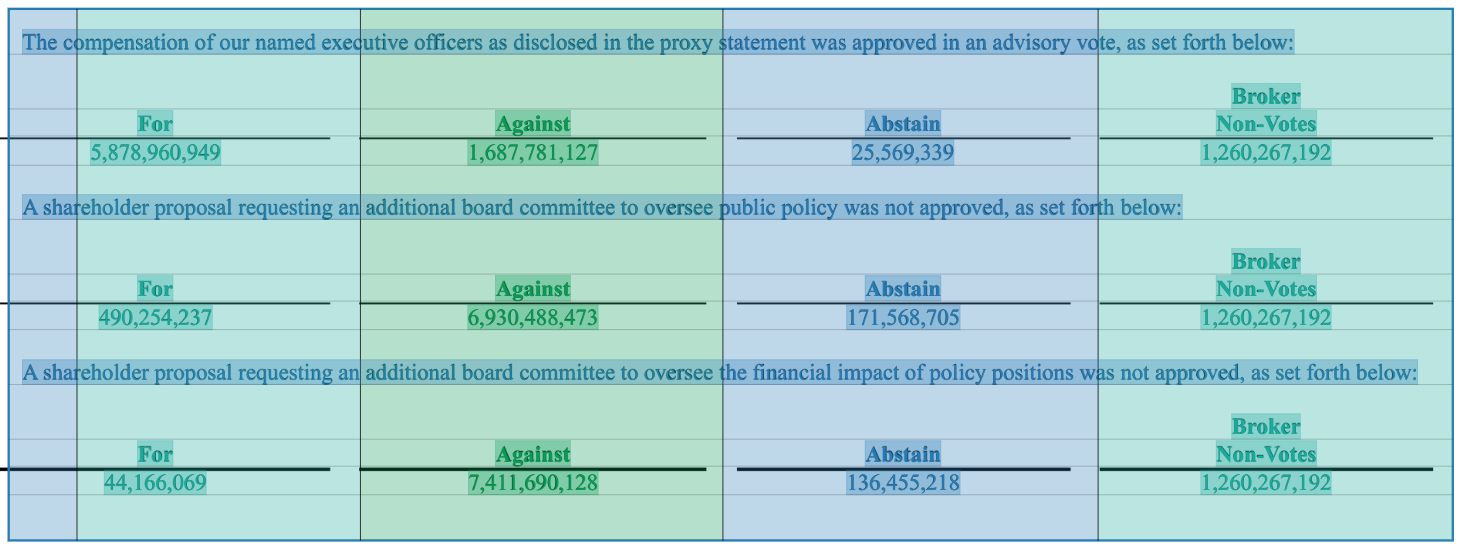
The resulting .xlsx file is shown below. Basic cleaning steps in a program such as Excel, R, or Python can be used to produce a dataset where each row contains a proposal description and vote totals. 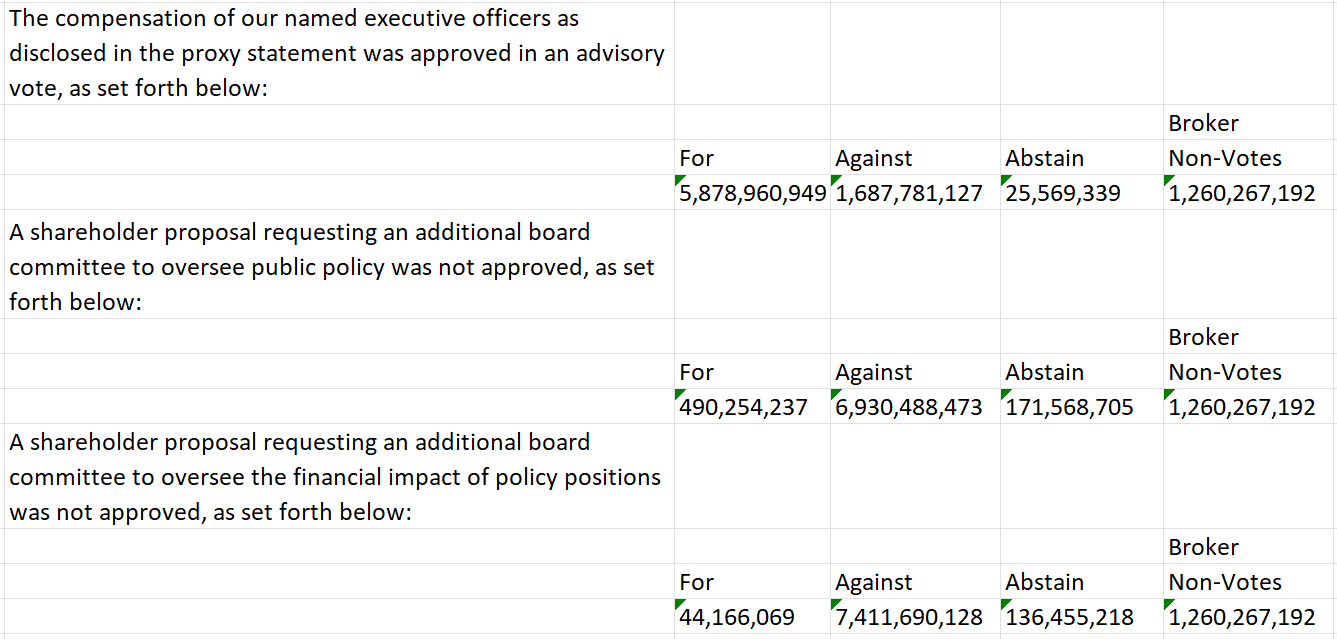
Layouts that Span Multiple Pages
When a single table layout applies to most or all pages within a document, it is not necessary to re-draw the layout on every page. Instead, the current layout can be set as “default” by clicking Save As Default. The default layout is applied to all pages that have not been edited manually. 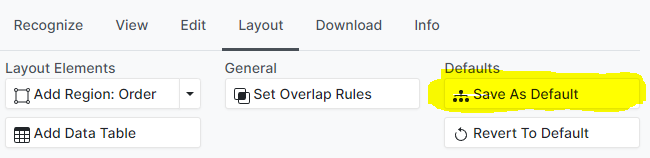
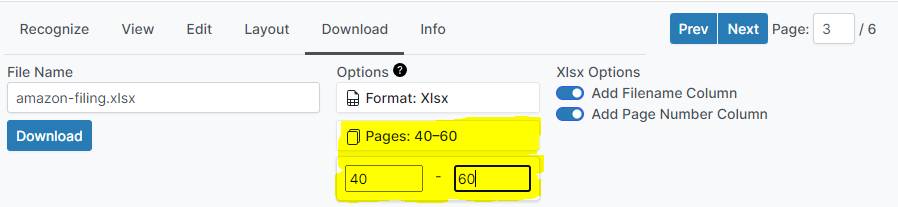
Applying Layouts to a Subset of Pages
It is not currently possible to automatically apply a layout to a subset of pages. The only way to apply a layout to multiple pages is by setting it as default, which applies it to all pages which have not been individually edited. However, as data can be subset to a specific page range during the download step, applying the default layout to unneeded pages is generally not problematic.
For example, say that a 100 page document contains tables in pages 40-60, and all tables have the same layout. This document could be processed by setting a single default layout, and setting the output to only include pages 40-60.